AI Selection Rate: How Often AI Picks Your Product

· By Xhurian Shaba, co-founder and CEO of ecentic

16 min read

AI selection rate is the share of shopping scenarios where an AI agent picks your product. Learn how to define it, calculate it, track it and improve it.

00

Introduction

Scenario cards converge on a selected product

Whether people google, go to Amazon or ask a chatbot, AI now gives them a response with a product in it, and most e-commerce brands have no idea how to be that product. AI selection rate is the number that tells you how often you are. You count the shopping scenarios where an AI agent chose your product as the final option, divide by all the scenarios you tested, and multiply by 100.

I think this is the most honest number in the whole agent-shopping conversation, mostly because it is hard to fake. A mention is cheap. A product can be named in every answer and still lose the sale at the last step, a bit like being invited to every wedding and never being the one who gets married. Selection is the moment the agent stops listing and starts picking.

ecentic
ecentic.ai
Find Out When AI Picks Your Products
See how AI assistants compare your products with named competitors and identify changes to the product data they read.
Check your store
01

TL;DR

TL;DR

  • AI selection rate is the percentage of tested shopping scenarios in which an AI agent picks your product as the final choice.
  • Decide what counts as a selection before you measure: best pick, shortlist winner, cart add, checkout start or completed order.
  • Report it per model and with dates. One blended score hides the fact that assistants disagree with each other.
  • Small week-to-week moves are usually noise. Repeat the same prompts many times before you believe a change.
  • The fastest lever is the data the agent reads: product feed, catalog and structured data on product pages.
02

What AI selection rate measures

What AI selection rate measures

An AI shopping agent does not browse your homepage. It reads your product feed, your catalog and the structured data on your product pages, compares what it finds with other sellers, and answers with one product, or a short list with a favorite. Selection rate counts how often that favorite is yours.

The formula is plain:

selection rate = scenarios where your product was selected / total scenarios analyzed × 100

A scenario is one shopping request, such as “a vitamin C serum for sensitive skin under $40” or “two bottles of a specific single malt, delivered to Texas.” You write a set of these for your products, run them, and record the outcome.

Here is a made-up example, just to show the arithmetic. You test one product against 40 scenarios. The agent picks it in 8. Your selection rate for that product is 20%. If your closest competitor is picked in 18, their rate is 45%, and the remaining scenarios went to other sellers or to nobody. That gap is the thing you work on.

Notice what the number is not. It is not traffic and it is not an order. It is the agent’s decision, which is the step that comes right before either of those.

03

Decide what counts as a selection

Decide what counts as a selection

This is where most teams get sloppy, and it is where the number stops meaning anything. “Selected” can mean at least five different things:

  • The agent names your product as the best option.
  • The agent chooses your product out of a shortlist of offers.
  • The agent adds your product to a cart.
  • The agent starts checkout.
  • The agent completes a purchase for the shopper.

These are stages of the same funnel, and they give very different rates. The first is generous. The last is strict, and today it is only possible in a few places. Buying inside the AI answer is live on Google AI Mode and Gemini in the US through UCP, Google’s open standard for agent checkout. ChatGPT sends the shopper to the store’s own checkout, so for ChatGPT the realistic final event is the agent choosing your product and the shopper clicking through.

My advice is to pick one definition, write it down and never change it mid-quarter. If you report “best option named” this month and “cart add” next month, you will celebrate a drop as a gain or the other way around.

04

How to calculate and track it

How to calculate and track it

You do not need a data science team. You need discipline. These are the steps I would follow.

  1. Pick your products. Start with the ten that matter most, by margin or volume.
  2. Write the scenarios. For each product, write realistic shopping requests in the way your buyers phrase them. Include price limits, use cases, delivery places and variants. Fix the list before you run it, so you cannot quietly drop the prompts that went badly.
  3. Name the rival. Agents choose between options, so each scenario needs a competitor product in the mix. Use the ones your customers actually cross-shop.
  4. Run each scenario many times, on each model. One run proves nothing, because the same prompt can produce a different answer on the next try.
  5. Log the model, the model version and the date next to every result. Model updates can reshuffle outcomes overnight.
  6. Calculate the rate per model, per product. Then, if you want, a portfolio view on top.
  7. Fix the data, then rerun the same scenarios. Compare like with like.

Doing this by hand works for a handful of products. It gets old fast. In ecentic, the equivalent run is automated: it connects to Shopify, WooCommerce or a product feed, has ChatGPT, Claude and Gemini compare each product with a named competitor’s, and shows why your product loses. Fair caveat: those are simulated shoppers, not real ones, so a better rate in a simulation is evidence about how agents read your data, not a forecast of orders.

05

Selection rate versus mentions, referrals and conversions

Selection rate versus mentions, referrals and conversions

Teams mix these up constantly, so here is the difference side by side.

Metric What it counts How close to the purchase
Mention rate How often your brand or product is named in an answer Far. Naming is not choosing
Recommendation rate How often it is suggested as a good option Closer, but a list can have five winners
Selection rate How often it is the final pick among the options Close. This is the decision
AI referral visits Visits that arrive from an AI assistant After the decision, if the shopper clicks
Conversion Orders from those visits The result

A product can show up in plenty of answers and still lose at the final step. The usual reasons are boring: a higher price, slower delivery, a missing variant, weaker return terms, thinner reviews or product data that is incomplete or out of date. Brands can rank fine in classic search and still be left out of the AI decision, which is the gap AI in ecommerce examples touch on when they describe how search and AI answers now overlap.

One more distinction. A simulated selection is not a sale. Referral visits are real, simulated selection is a test, and revenue is its own measurement. Keep them in separate columns. If you want the longer argument about measuring agent traffic, I wrote it up in our guide to ecommerce AI analytics.

06

Why you need a rate per model, not one score

Why you need a rate per model, not one score

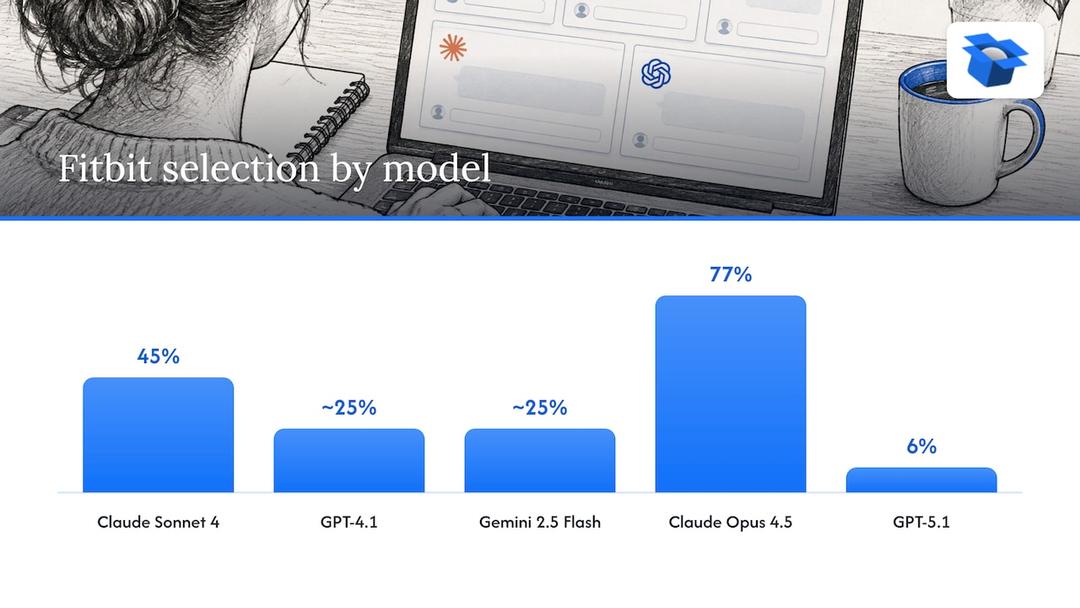
Assistants do not agree with each other, and they do not agree with themselves across versions. A 2025 academic study, What Is Your AI Agent Buying?, ran agents through the same product assortment. In the fitness watch category, Claude Sonnet 4 picked one Fitbit model 45% of the time, while GPT-4.1 and Gemini 2.5 Flash picked it about 25% of the time. The share then jumped to 77% with Claude Opus 4.5 and fell to 6% with GPT-5.1.

Fitbit selection rates vary across AI models

Read that twice. Same products, same shelf, wildly different winners, depending on which model was asked. A blended average of those numbers would describe no real shopper.

Our own simulations show the same split. By October 2026 we had run 36,797 simulated purchases. On the same catalog, ChatGPT picked the product about 3x as often as Claude or Gemini, 51.6% against about 18.5%. I will not pretend to know why every time. I think part of it is that each model weighs price, brand names and data completeness differently. The practical point is simple: report each assistant on its own line, with a date.

It also changes what you do next. If you lose on one model and win on another, you have a specific diagnosis instead of a vague feeling that “AI doesn’t like us.”

07

What moves the rate

What moves the rate

The agent only knows what your data tells it. So the biggest movers are the least glamorous.

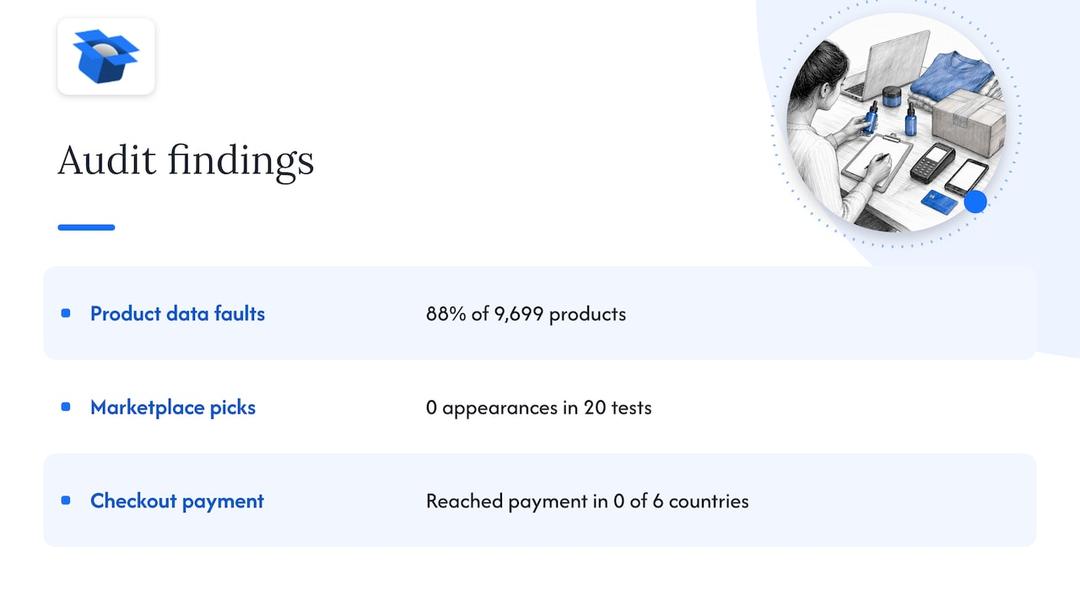
Product data faults. A title that says “Serum 30ml” gives an agent nothing to match against a request about sensitive skin. A description written for a poster, not for a decision, has the same problem. In one anonymous audit, a spirits marketplace doing about €70M a year had a fault in the data agents read on 88% of its 9,699 products. When agents were asked where to buy two bottles it stocks, it came up 0 times in 20. Great catalog, invisible shelf.

Structured data. This is the machine-readable layer on a product page: price, availability, brand, identifiers, shipping and return details. Agents lean on it because it is unambiguous. Missing or contradictory fields are easy to lose on.

Competitor comparison. Agents rarely judge your product alone. They put it next to another one. If the competitor’s listing states a use case, a material and a return policy, and yours does not, the competitor wins. That is why we have the models compare each product with a named rival and explain the result in plain English.

Position and order. Research on agent selection has found that models can be biased by where a product sits in the list. If you test, randomize the order of options, or you will measure the layout and not the product.

The checkout itself. Selection does not end at the pick. In another anonymous audit, a Swedish skincare brand’s agent checkouts reached payment in 0 of 6 countries, because a shipping setting asked for a phone number. An agent cannot invent one, so the order died. If your goal is to sell and not merely be chosen, the checkout path is part of the product data.

For the mechanics behind these agents, how AI shopping agents recommend products goes through what they read and in what order. For the listing side, see AI product listing optimization.

What moves the rate

08

How to read a change in the rate

How to read a change in the rate

Your rate moved from 20% to 25%. Congratulations or noise? Usually noise, until proven otherwise.

Three habits help. First, sample enough: if each scenario ran once, a swing of a few points is a coin flip. Run many independent trials per model. Second, look at the size of the change and how much it could wobble, not only whether it is “significant.” A tiny shift with a wide margin tells you nothing. Third, tie every comparison to a model version. If a vendor updated its model between your two runs, you may be comparing two different shoppers.

When you did change something, say you rewrote 20 titles, rerun the same fixed scenarios on the same models and compare only those products. If the products you touched moved and the untouched ones did not, you have a real signal. That is as close to a controlled experiment as a store owner is going to get.

09

Our perspective

Our perspective

I think selection rate will become a standard line in e-commerce reports within a couple of years, and I think most brands will first meet it the unpleasant way: by finding out they score close to zero.

We built ecentic around one belief. The agent never sees your homepage. It reads the product feed, the catalog and the structured data, and on Google AI Mode and Gemini in the US it can even check out for the shopper through UCP. So the work belongs on the store itself, not on a dashboard that reports a problem and leaves it there.

That is why our flow ends with action. We have ChatGPT, Claude and Gemini compare each product with a named competitor’s, show why yours loses, and when you click Apply, ecentic rewrites the title, description and structured data and publishes them to your store. On Shopify, we push the fixes into Google Merchant Center and track visits from AI assistants. On WooCommerce, the free ecentic plugin lets agents search, fill a cart and check out through UCP. Checking out is the part plain feed tools do not do.

I will be straight about the limits. We are early, we are running pilots, and our first one, DUA Flavours, saw visits from AI assistants and direct traffic rise 12% from April to July 2026. That is a visits number, not a sales number, and I would rather say so than let you read more into it.

OpenAI has ACP, Google has UCP, Amazon has a wall. Whichever way that settles, the store with clean, complete product data will be the one an agent can actually buy from.

Xhurian Shaba

10

Find your own number

Find your own number

The quickest way to see where you stand is to run it. ecentic helps online stores sell when AI agents do the shopping: it optimizes their product feed and catalog so AI shopping agents pick their products and can actually buy them. Get the sale when AI does the shopping.

The free scan covers your top 10 products and needs no card. If you want to fix what it finds, the plans are published on the ecentic pricing page: Compete is $14.90 per month for up to 100 products, Scale is $44.90 per month for up to 1,000 products with one-click fixes, and Dominate is $149 per month and adds Google Merchant Center sync and agent checkout setup. There is also a pay-as-you-go option at 3% of AI-attributed orders, capped at $500 per month.

ecentic

If you want to see how the process works before you sign up, how ecentic works walks through simulate, diagnose and optimize step by step.

11

FAQ

FAQ

What is a good AI selection rate?

There is no credible universal benchmark, because the rate depends on your category, your competitors, the scenarios you wrote and the model you test. A more useful target is to beat the named competitor you lose to most often, on each assistant, and to see your own number rise after you fix data. Treat any single “industry average” with suspicion.

How is AI selection rate different from AI visibility?

Visibility usually means you are mentioned or listed. Selection means the agent chose your product over the other options. A brand can be named often and still lose the final pick, so selection sits much closer to the purchase decision.

How often should I check my AI selection rate?

Check after you change something, and keep the scenarios identical between runs. Models update, so date every result and note the model version. Week-to-week wobble without a change on your side is mostly noise.

Does a higher selection rate mean more sales?

Not automatically. A simulated selection is a test of how agents read your data, not a sale. It is a strong leading indicator, but orders also depend on price, delivery, checkout and whether the shopper completes the purchase. Measure referral visits and orders separately.

Guides and research on winning AI shopping agents.